Takeuchi $6432 against Kubota - David is winning all the way to Goliath
We will analyze a hidden Japanese champion in the compact excavator and loader products and compare it with a much larger and well know Japanese champion Kubota. A David versus Goliath comparison. A small cap against a large cap of Japan. Kubota has a much broader product line up and 15x larger in terms of sales. We will compare companies in terms of:
The article constitutes my personal views and is for entertainment purposes only. The main goal of this article is to log my personal views. Nothing in this article or these posts in this blog should constitute an investment advice. The projections and estimates provided here should be considered as purely speculative. Do your own model and projections. Please refer to the disclaimer at the end of this article for more details.
Sales and sales growth
Operating income margin
Operating income growth
EPS
Financial health
Shareholder yields
Valuation
Other considerations
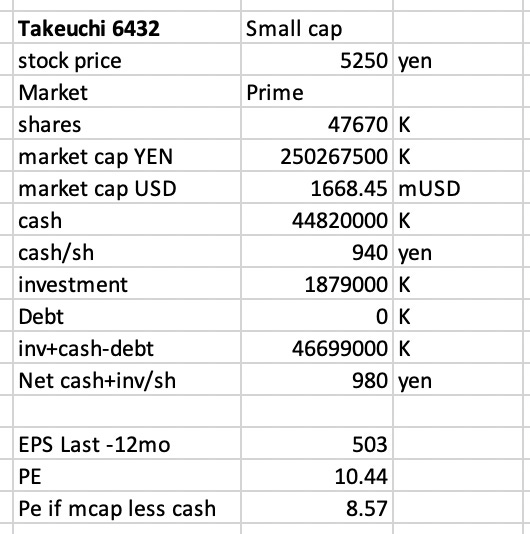
Key Financial Metrics on Feb 29 2024
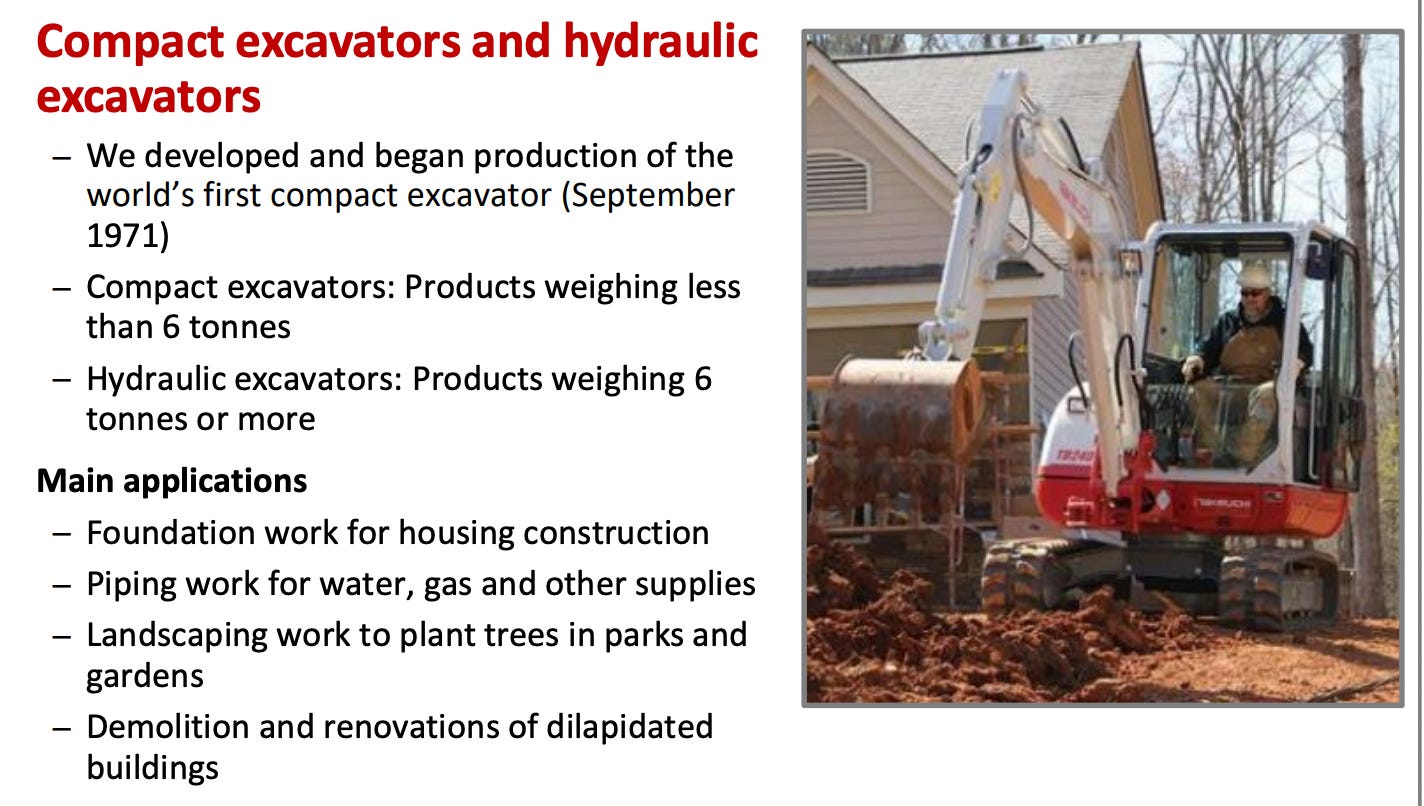
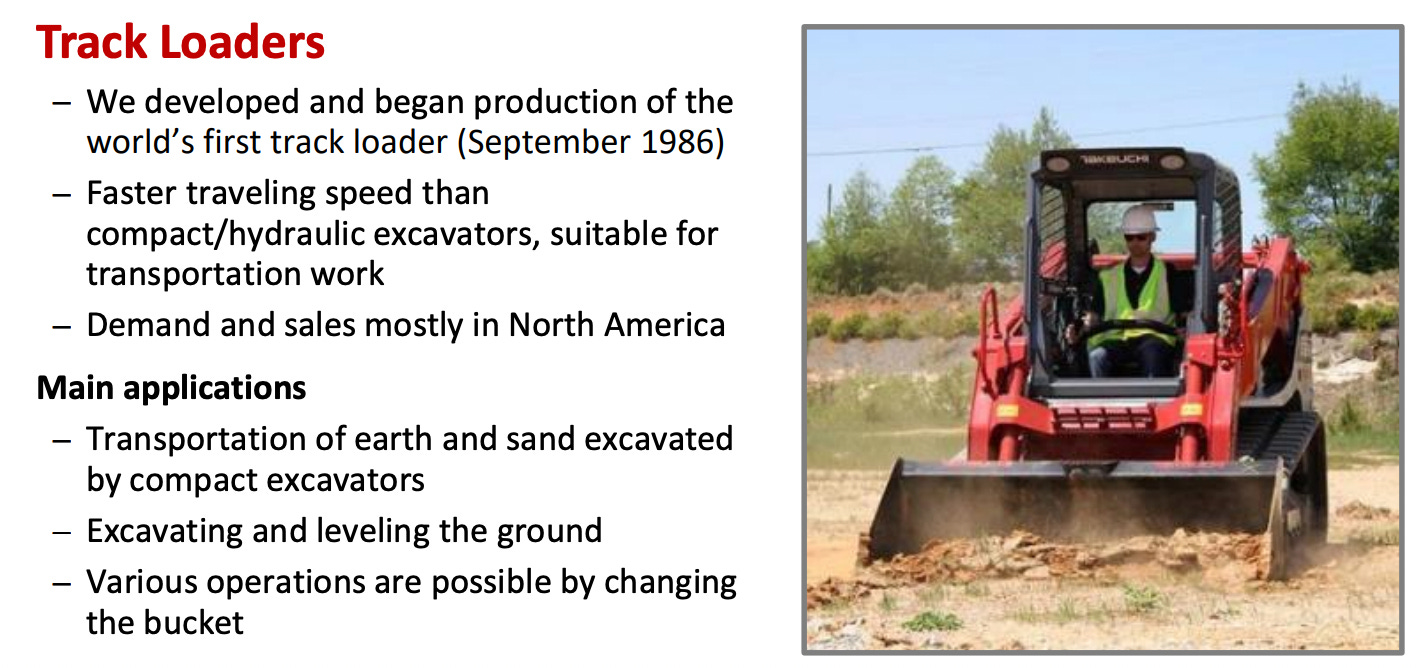
Main Product - Compact Excavator and Compact Loader
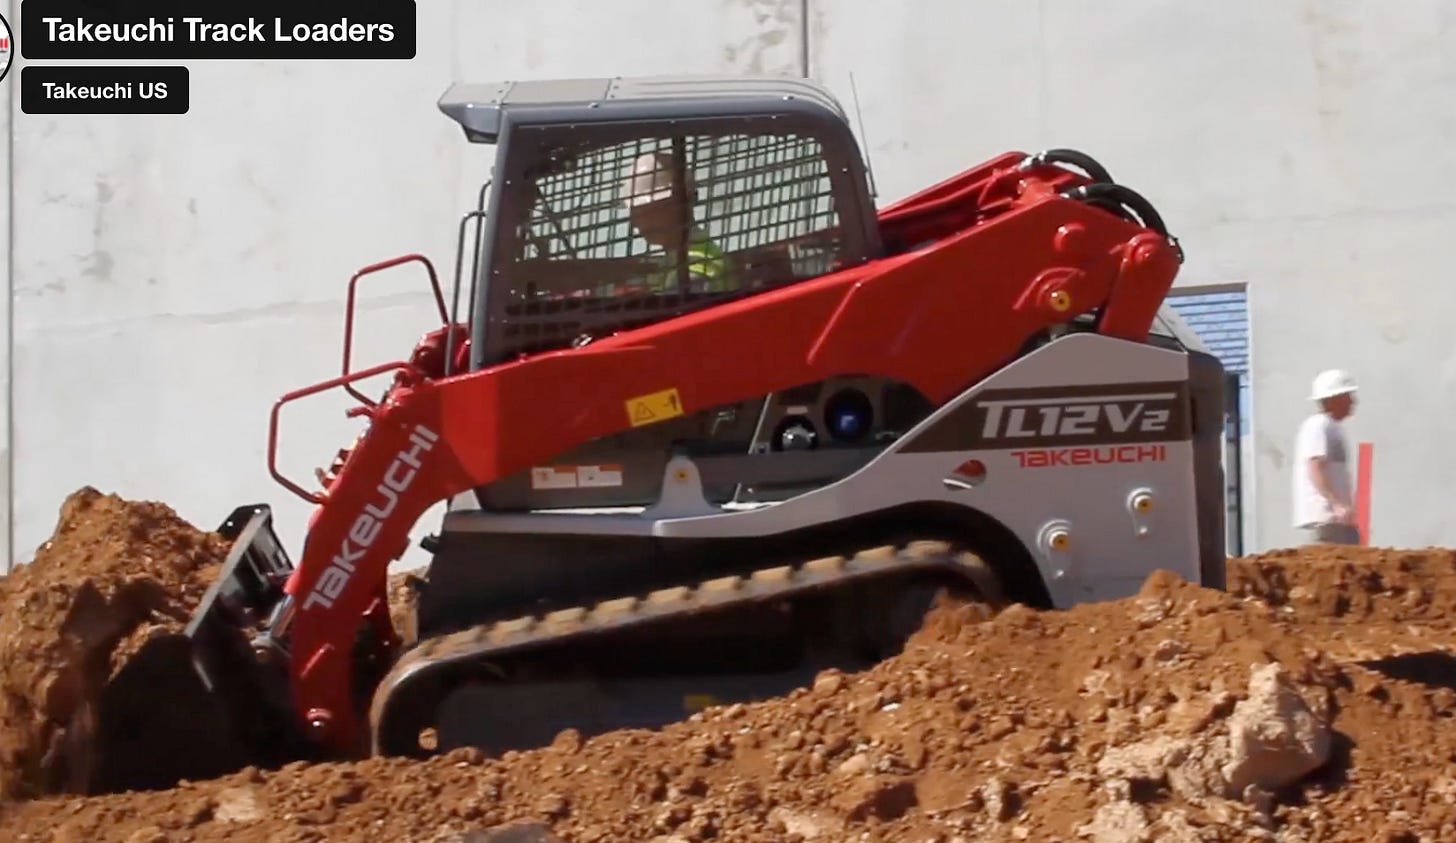
Although much smaller, Takeuchi is very innovative and has developed the first compact excavator in 1971 and the first compact track loader (CTL) in 1986. CTL are mostly used in North America, particularly in areas where the soil is rich in clay. CTL are often used to lay fiber optics and gaz pipeline.
Revenue growth story (Takeuchi > Kubota)
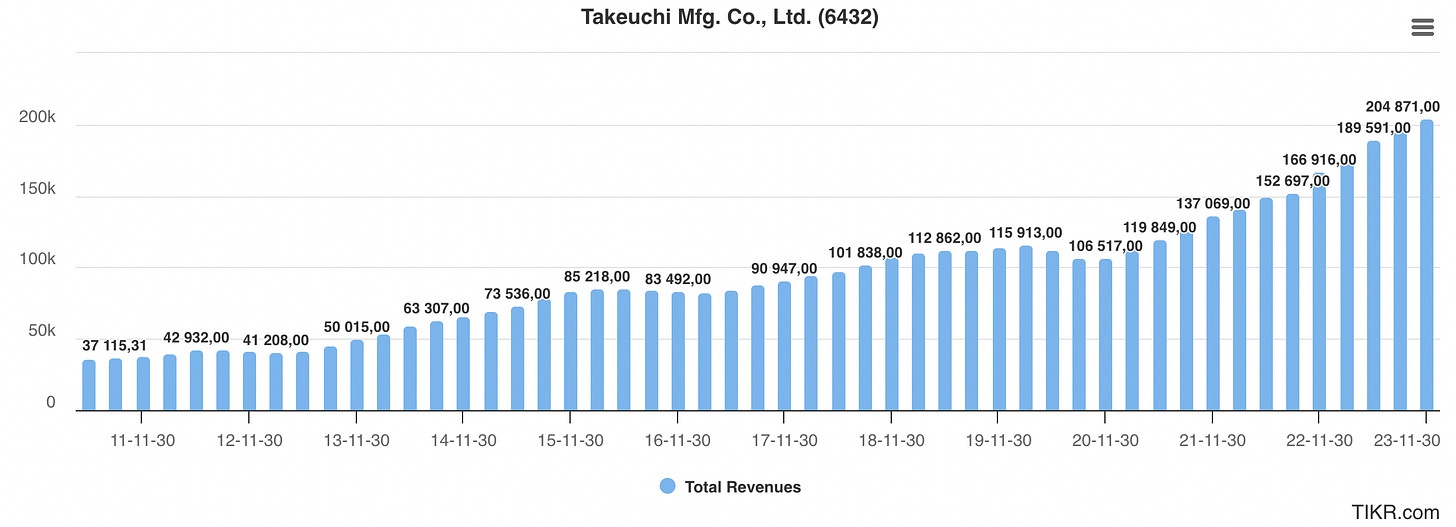
Takeuchi revenue growth has been outstanding in the last 12 years, growing from 37B yen to 204B yen or 5.5x.
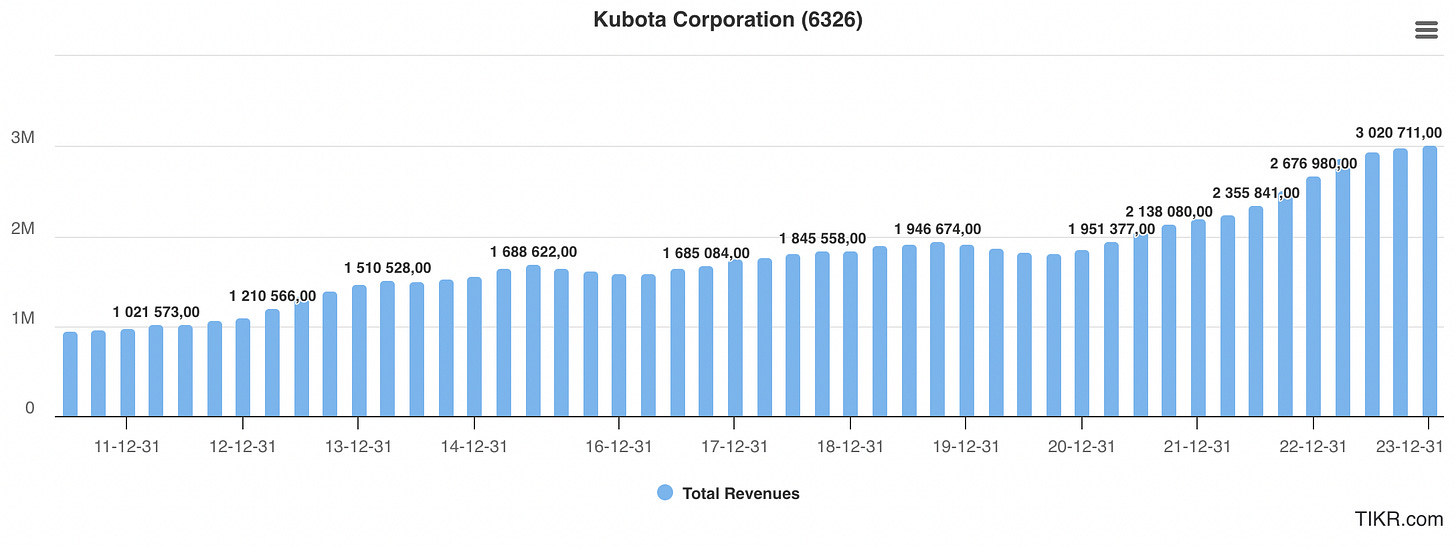
If you look at its closest and much larger peer Kubota, Kubota has grown revenue by 3x - from 949B yen to 3020B yen.
So, in 2011, Takeuchi was 25x smaller than Kubota. Both companies enjoy steady growth, with limited downturn.
Rising Operating Margin (Takeuchi ~ Kubota)
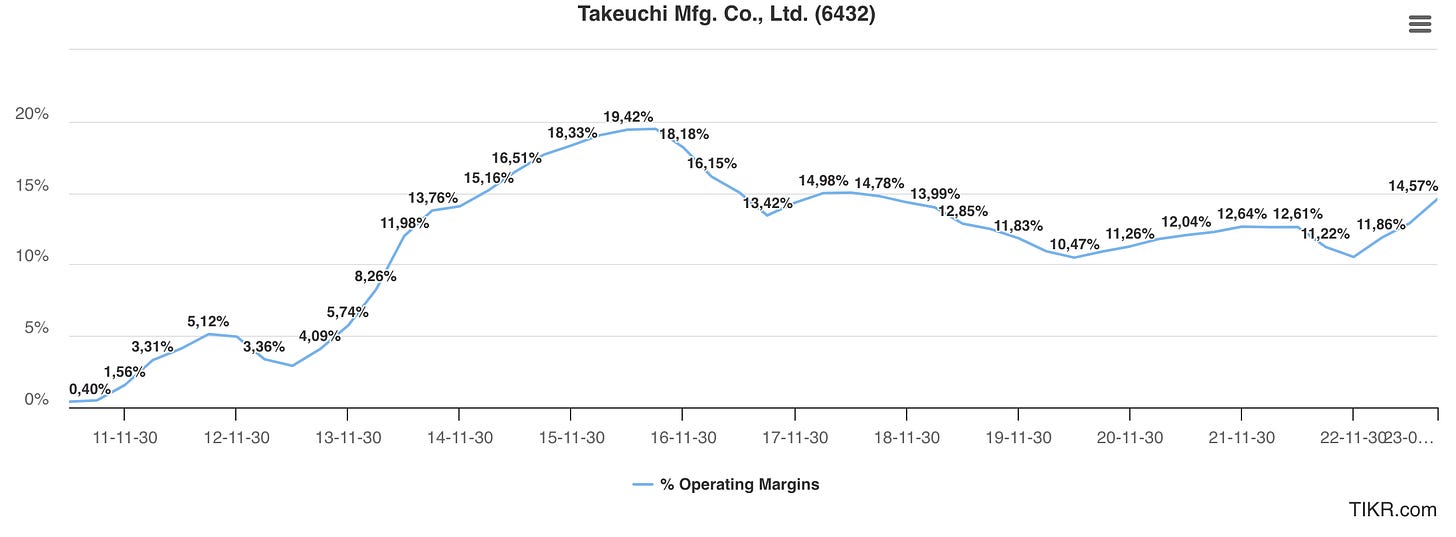
Takeuchi has seen a steady rise in operating income from 2011 to 2015, which have level off in a range of 10% to 18%, currently at 14.57%.
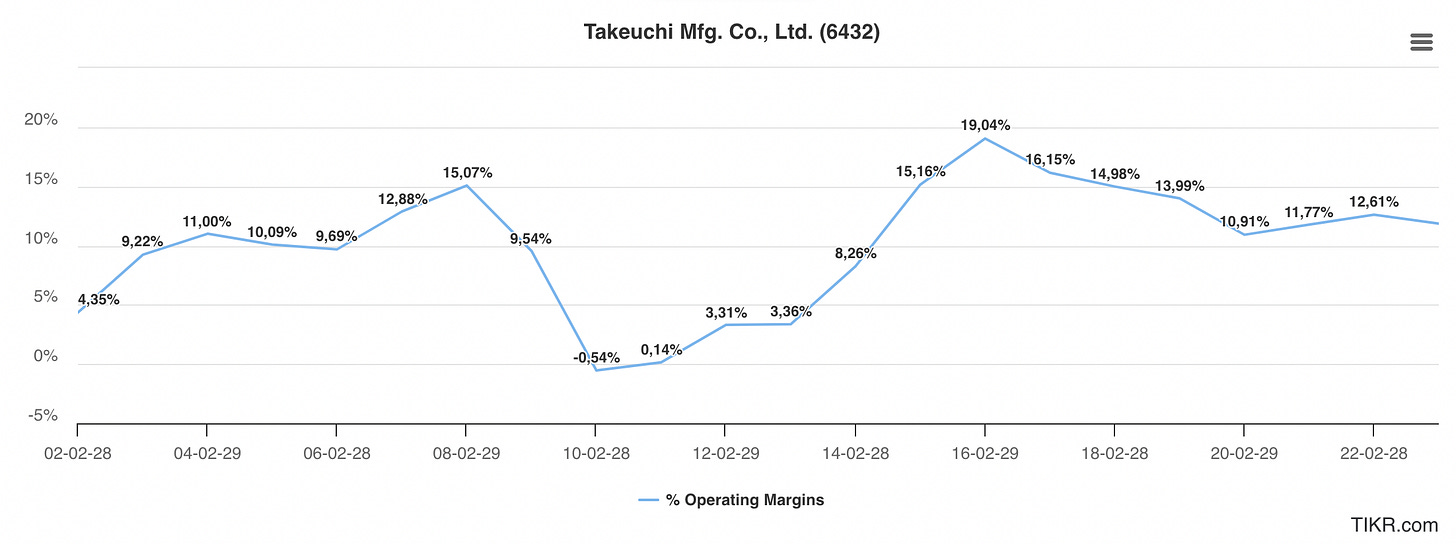
If you look back 20 years, margin was around 10% prior to the GFC. North America is Takeuchi’s largest market, so the hiatus in construction might have explained the steep drop in margin in 2009-2012. It was also very difficult in Europe in that time - the second largest market.
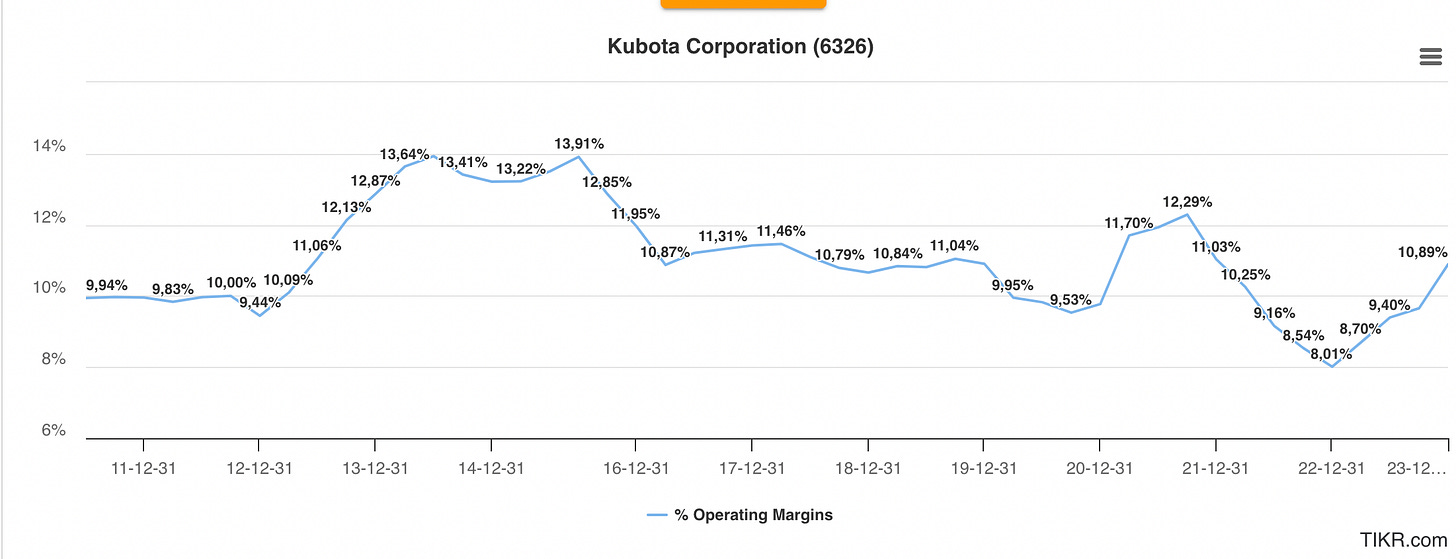
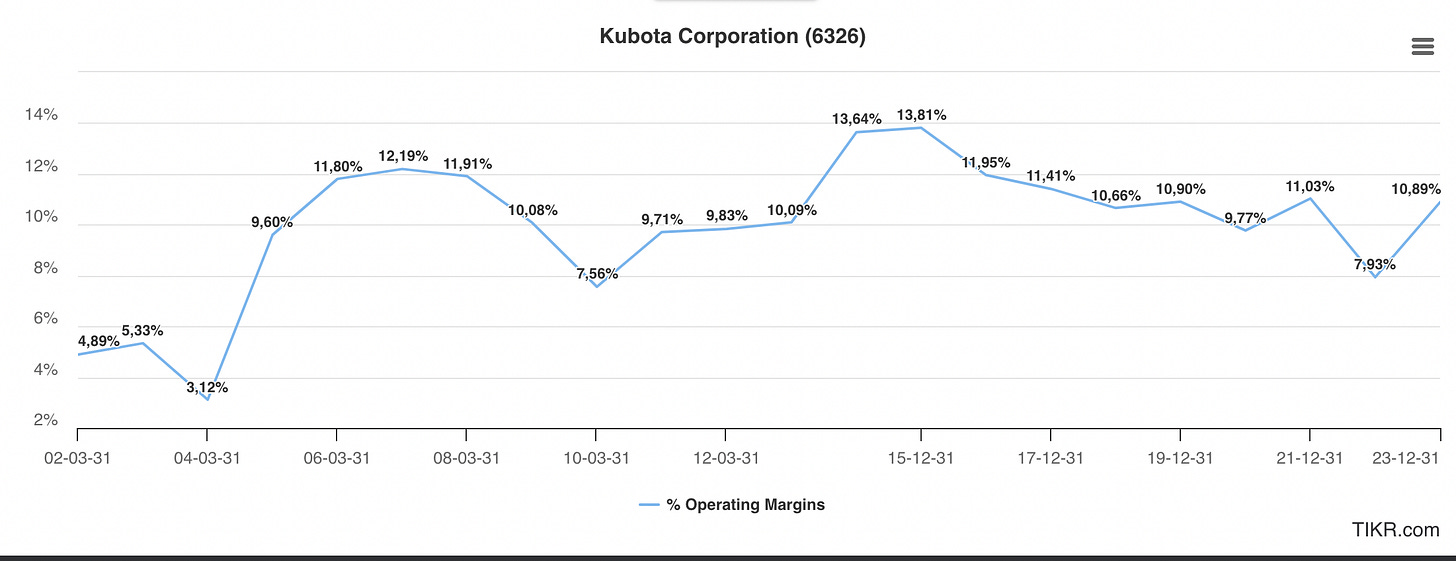
Kubota’s operating margin is much more stable, hovering around from 8% to 13%, currently at 10.89%.
In light of this, I would say that Takeuchi is earning better margin recently but more fragile in case of a financial downturn in construction work.
Operating Income Growth (Takeuchi > Kubota)
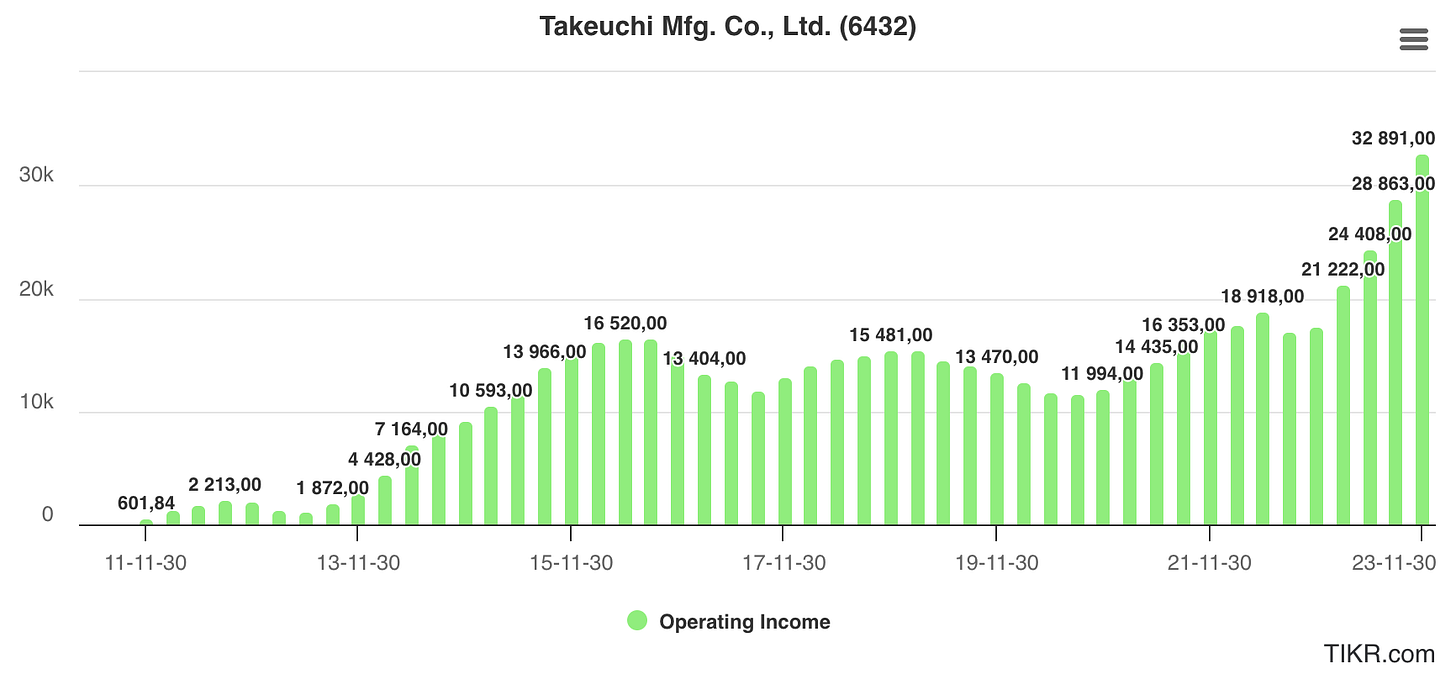
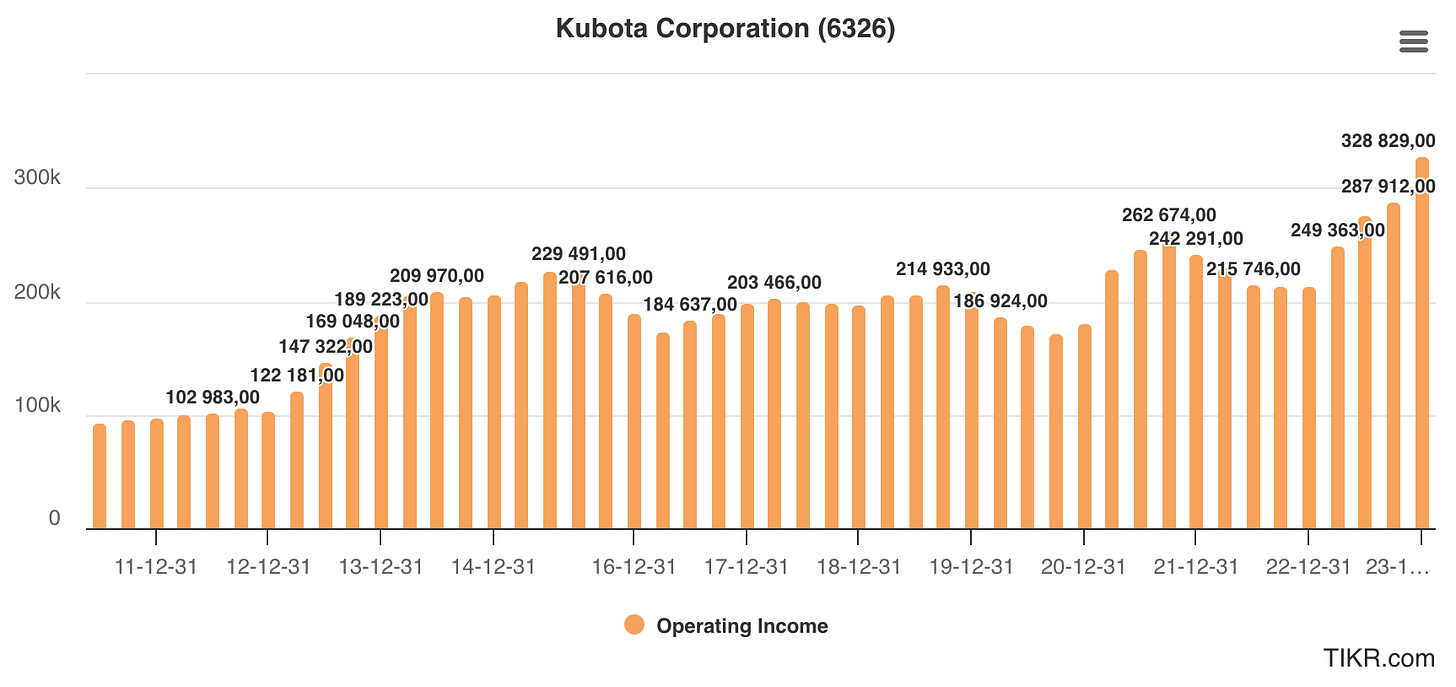
Takeuchi has seen a very strong growth in operating income from 2011 to 2015, and then managed to double again operating earnings based on the latest 12mo.
Kubota has seen also a sharp increase in operating income to 229B in 2015 and recent earnings is up 50% since then to 328B in the last 12mo. The recent momentum in earnings growth for Takeuchi is much steepier.
Financial health (Takeuchi > Kubota)
Takeuchi has a market cap of 261B yen and a net debt of negative -45B yen for a total enterprise value of 216B yen. Net debt to EBITDA negative, meaning that net cash is 1.27x EBITDA.
In contrast, Kubota has a market cap of 2577B yen and a net debt of 1768B yen for a Net debt to EBITDA of 4x.
Shareholder yield (Takeuchi ~ Kubota)
Takeuchi is projected to pay 158yen per share or 3%. No significant stock buyback was done in recent years.
Kubota is projected to pay 43yen per share or 2%. Kubota is buying back about 1% per year of its stock.
EPS growth (Takeuchi > Kubota)
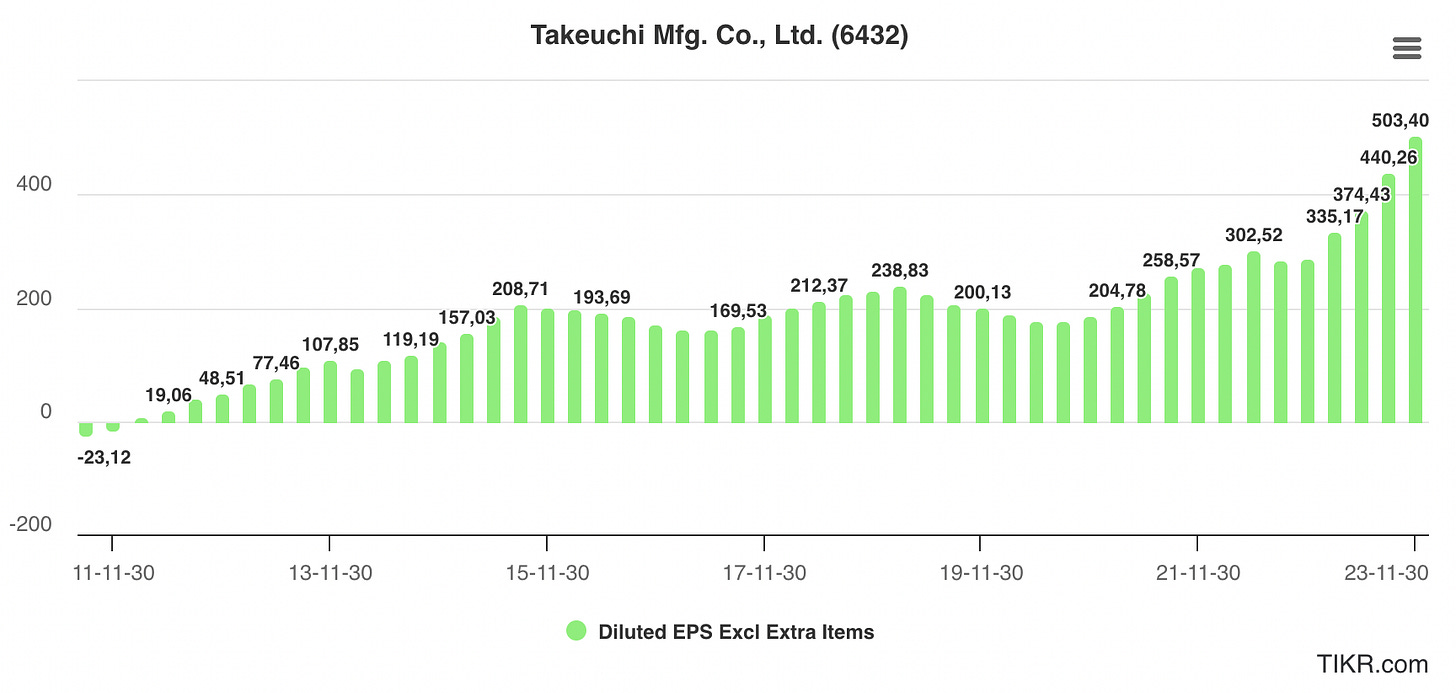
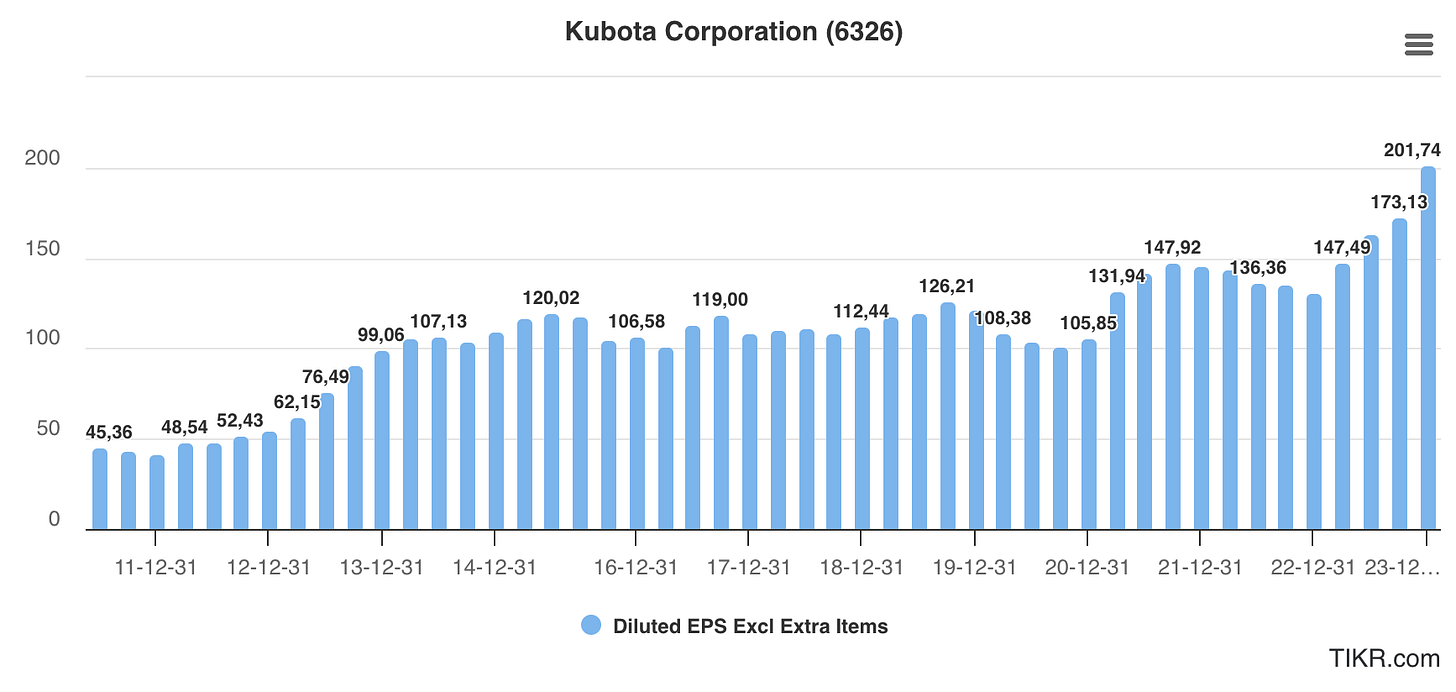
Takeuchi EPS growth has been steep and steady since 2011 going from 19yen to 503yen. Since 2015 peak, EPS has increased by 150%.
Kubota EPS growth has not been as fast from the peak of 2015, with an increase of 66%.
Valuation (Takeuchi > Kubota)
The best fair valuation considering the big difference in terms of debt level is to look at EBITDA and EBIT over the enterprise value.
Takeuchi: EBITDA/EV = 6.1 and EBIT / EV = 6.5
Kubota: EBITDA/EV = 9.9 and EBIT/EV = 13.7
So Takeuchi is trading at a discount of 40% to 53% to Kubota.
Return on Capital (Takeuchi > Kubota)
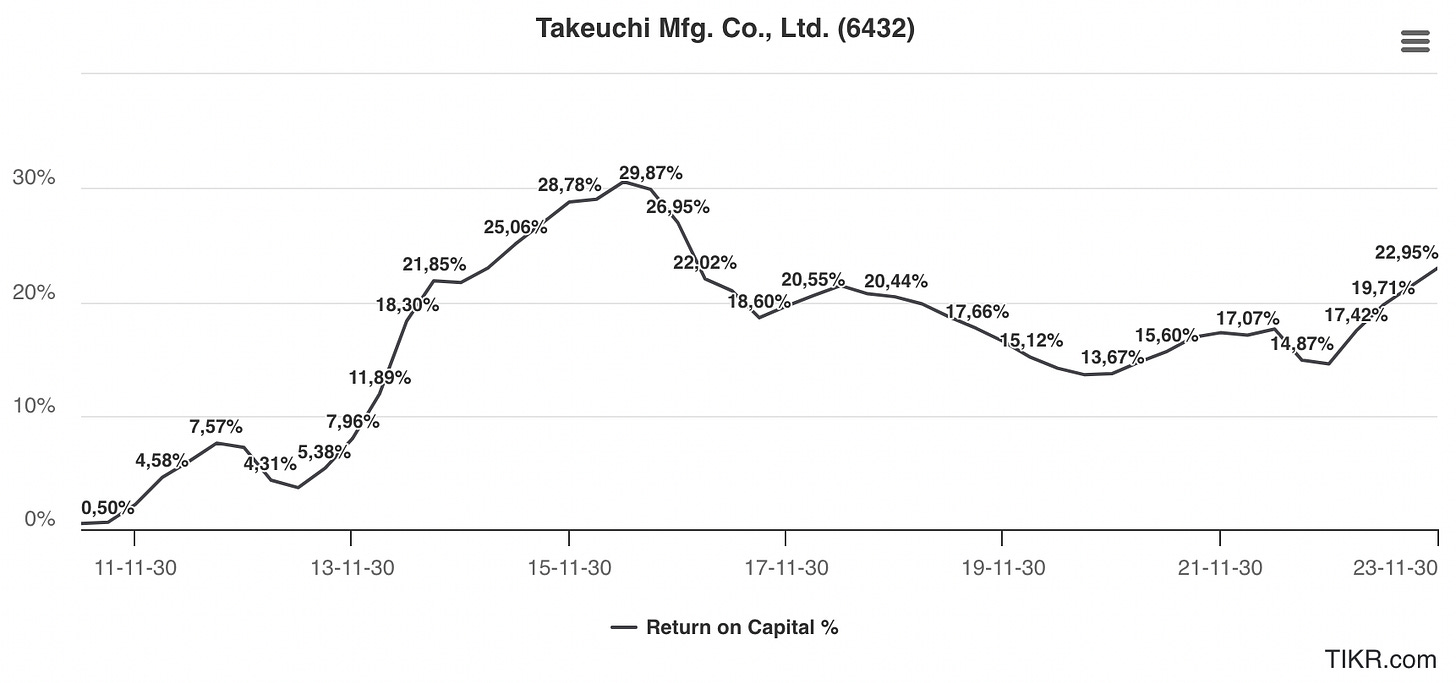
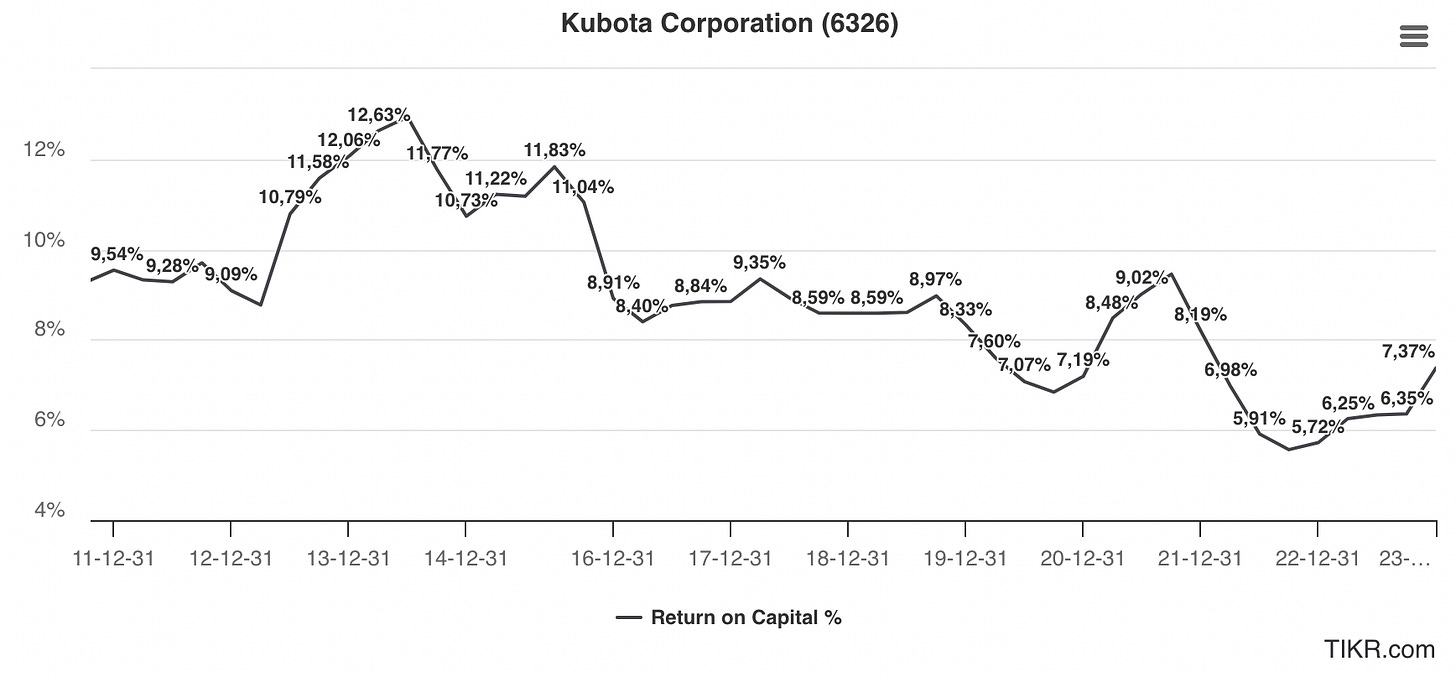
Return on Capital is impressive for Takeuchi, howering between 14% to 30%, currently at 23%.
Exports - nothing but Exports
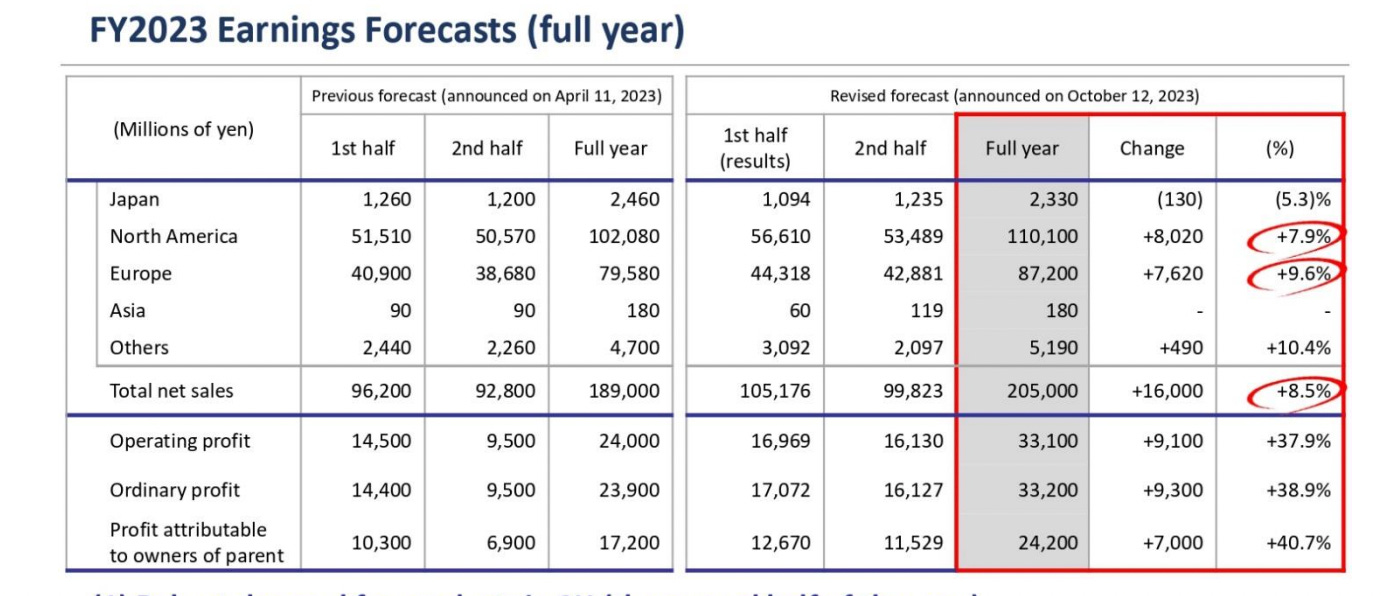
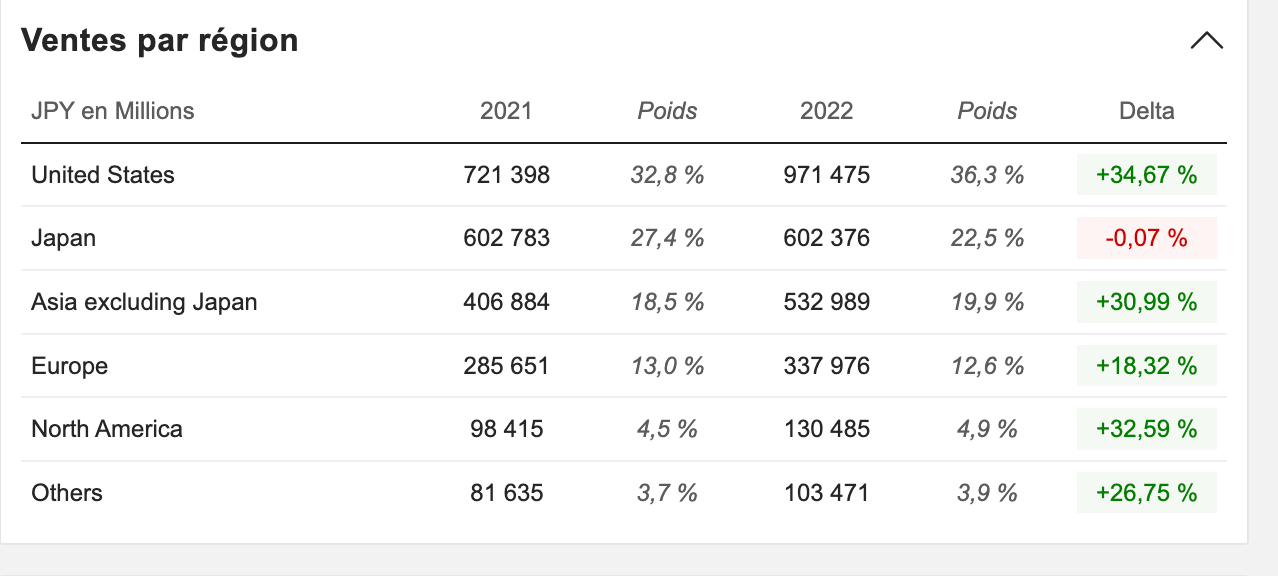
99% of sales is to the export market for Takeuchi. More than 54% of sales is to North America, 43% is Europe and the rest is split between the RoW and Japan. I am struggling here to understand how come the Japan market is so small. In any case, considering the weak yen and the decrease in population of the domestic market, it is not a bad thing to be 99% of sales driven by export. I also like the importance of NA sales, as NA - at least in the short term, has a much stronger economy than the RoW. There are also strong demographic trend in NA (both Canada and USA).
Kubota has 27% of sales in Japan.
Family owned Business (Takeuchi > Kubota)
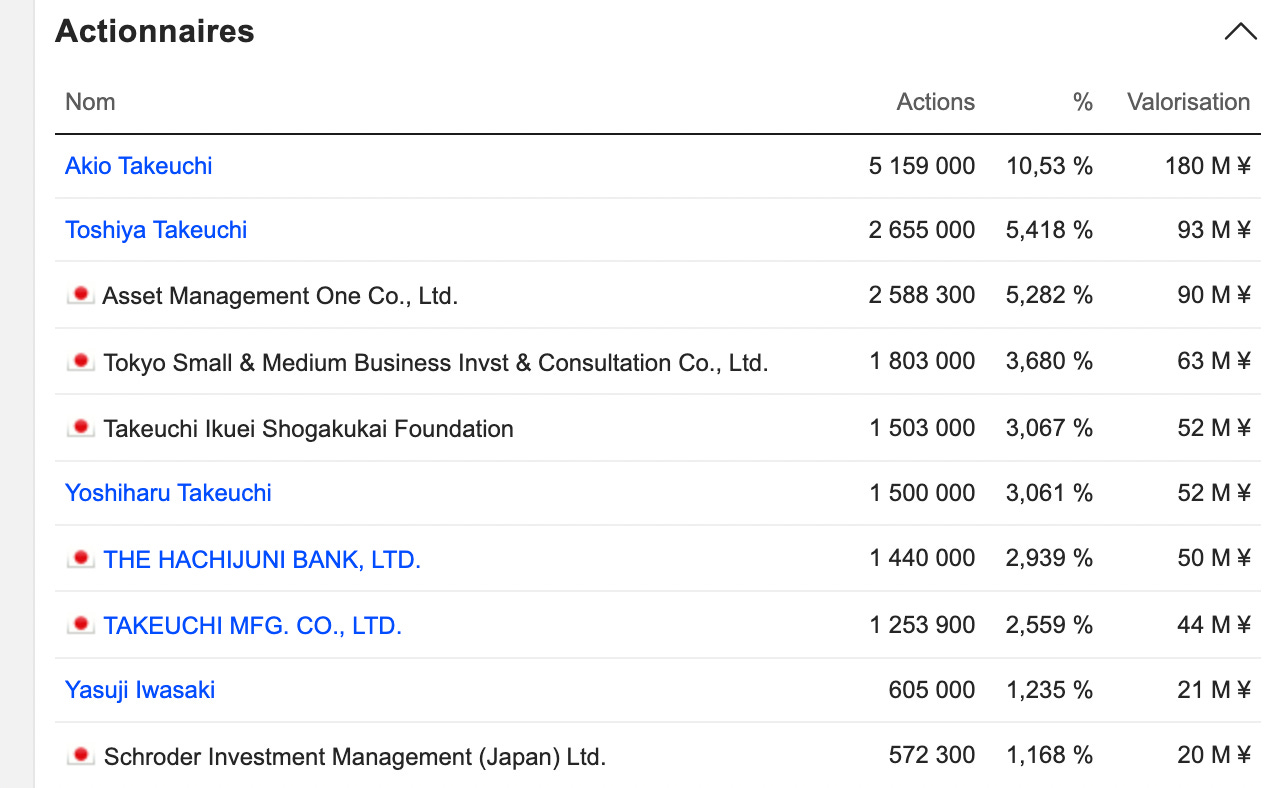
Takeuchi is still a family owned business with founder and son having 16% of the company and another 6% to the family. In contrast, Kubota does not seem to have retain family owndership
Takeuchi Pros and Cons
Pros:
Superior investment versus Kubota in terms of Valuation, Financial health, recent operating margin, Growth and RoI.
At 6.5 EV /EBIT and having increase EPS by 150% since 2015, Takeuchi is trading at an attractive price.
Takeuchi is Cash rich and without debt
Family owned
Very focus on NA and Europe
The need of compact excavator and loader is growing due to construction, landscaping or land clearing in dense urban, suburban areas.
Takeuchi is moving some of its manufacturing to US which should reduce cost. It is currently planned to move the production of CTL product there. Again, most of the CTL products are for NA. The manufacturing migration is ongoing.
Cons:
Much narrower product line. Focus on compact product.
Might be more tied to residential construction, landscaping
Kubota addresses market like rice seeding, much stronger in ag market
Takeuchi does not benefit from synergies accross markets. Economy of scale of common components like engine, wheels.
Lack of presence in domestic market for Takeuchi is puzzling
Kubota is #1 or #2 in many of its markets. Takeuchi is #3 to #5 in its key market.
Takeuchi is in investing mode, building 2 new plants, 1 in NA and 1 new plant in Japan. So free cash flow is reduced and is lower than net income.
Please leave some comments. This is my reward. if you have appreciated this free article, let me know. If you have a question, or some aspects that you think should be investigated more, please let me know. If you have some knowledge on the industry, please add your take, that would be awesome for me.


Thanks for this great write-up.
Quick question shouted from the hip, could it be the improved operating margin is due to the inflation? e.i. They had cheap raw material inventory but were able to sell the new products to inflated price, but will now have to buy raw material at full price while keeping price steady.
Thanks for the write up, learned a lot.
Do u have any stats on market share for their core product categories?
Could them exporting over selling domestically be due to higher prices being paid by foreign buyers?